Table of Contents
Welcome!
Quick short introduction to myself, my name is Alexander Trost. I’m a sysadmin who loves automation, containers, coding in Go, playing games but also with new technologies. I’m currently working at Cloudical as a DevOps Engineer, helping companies move to the cloud and / or to container technologies (e.g., Docker, Kubernetes, etc).
Goal of the Training
The training is going to show how simple it is to get started with containers. In this case Docker is used, as it is the most popular container toolchain and runtime right now. After getting to know containers and Docker, we will hopefully realize that there is a need for some kind of magical orchestration layer to run applications and more in containers (in an orchestrated way). The important if you haven’t noticed here is the orchestration of containers in an automated and orchestrated manner.
Goal of the day
Goal of the day is to look into Kubernetes itself by going over the architecture and components of a Kubernetes cluster. Besides that we will take a closer look at the configuration of kubelet and Kubernetes master components. Then we will go over operational topics, like monitoring, logging and storage.
Architecture + Components
Information can also be found in a more compact format here: Kubernetes Components Overview - Kubernetes.
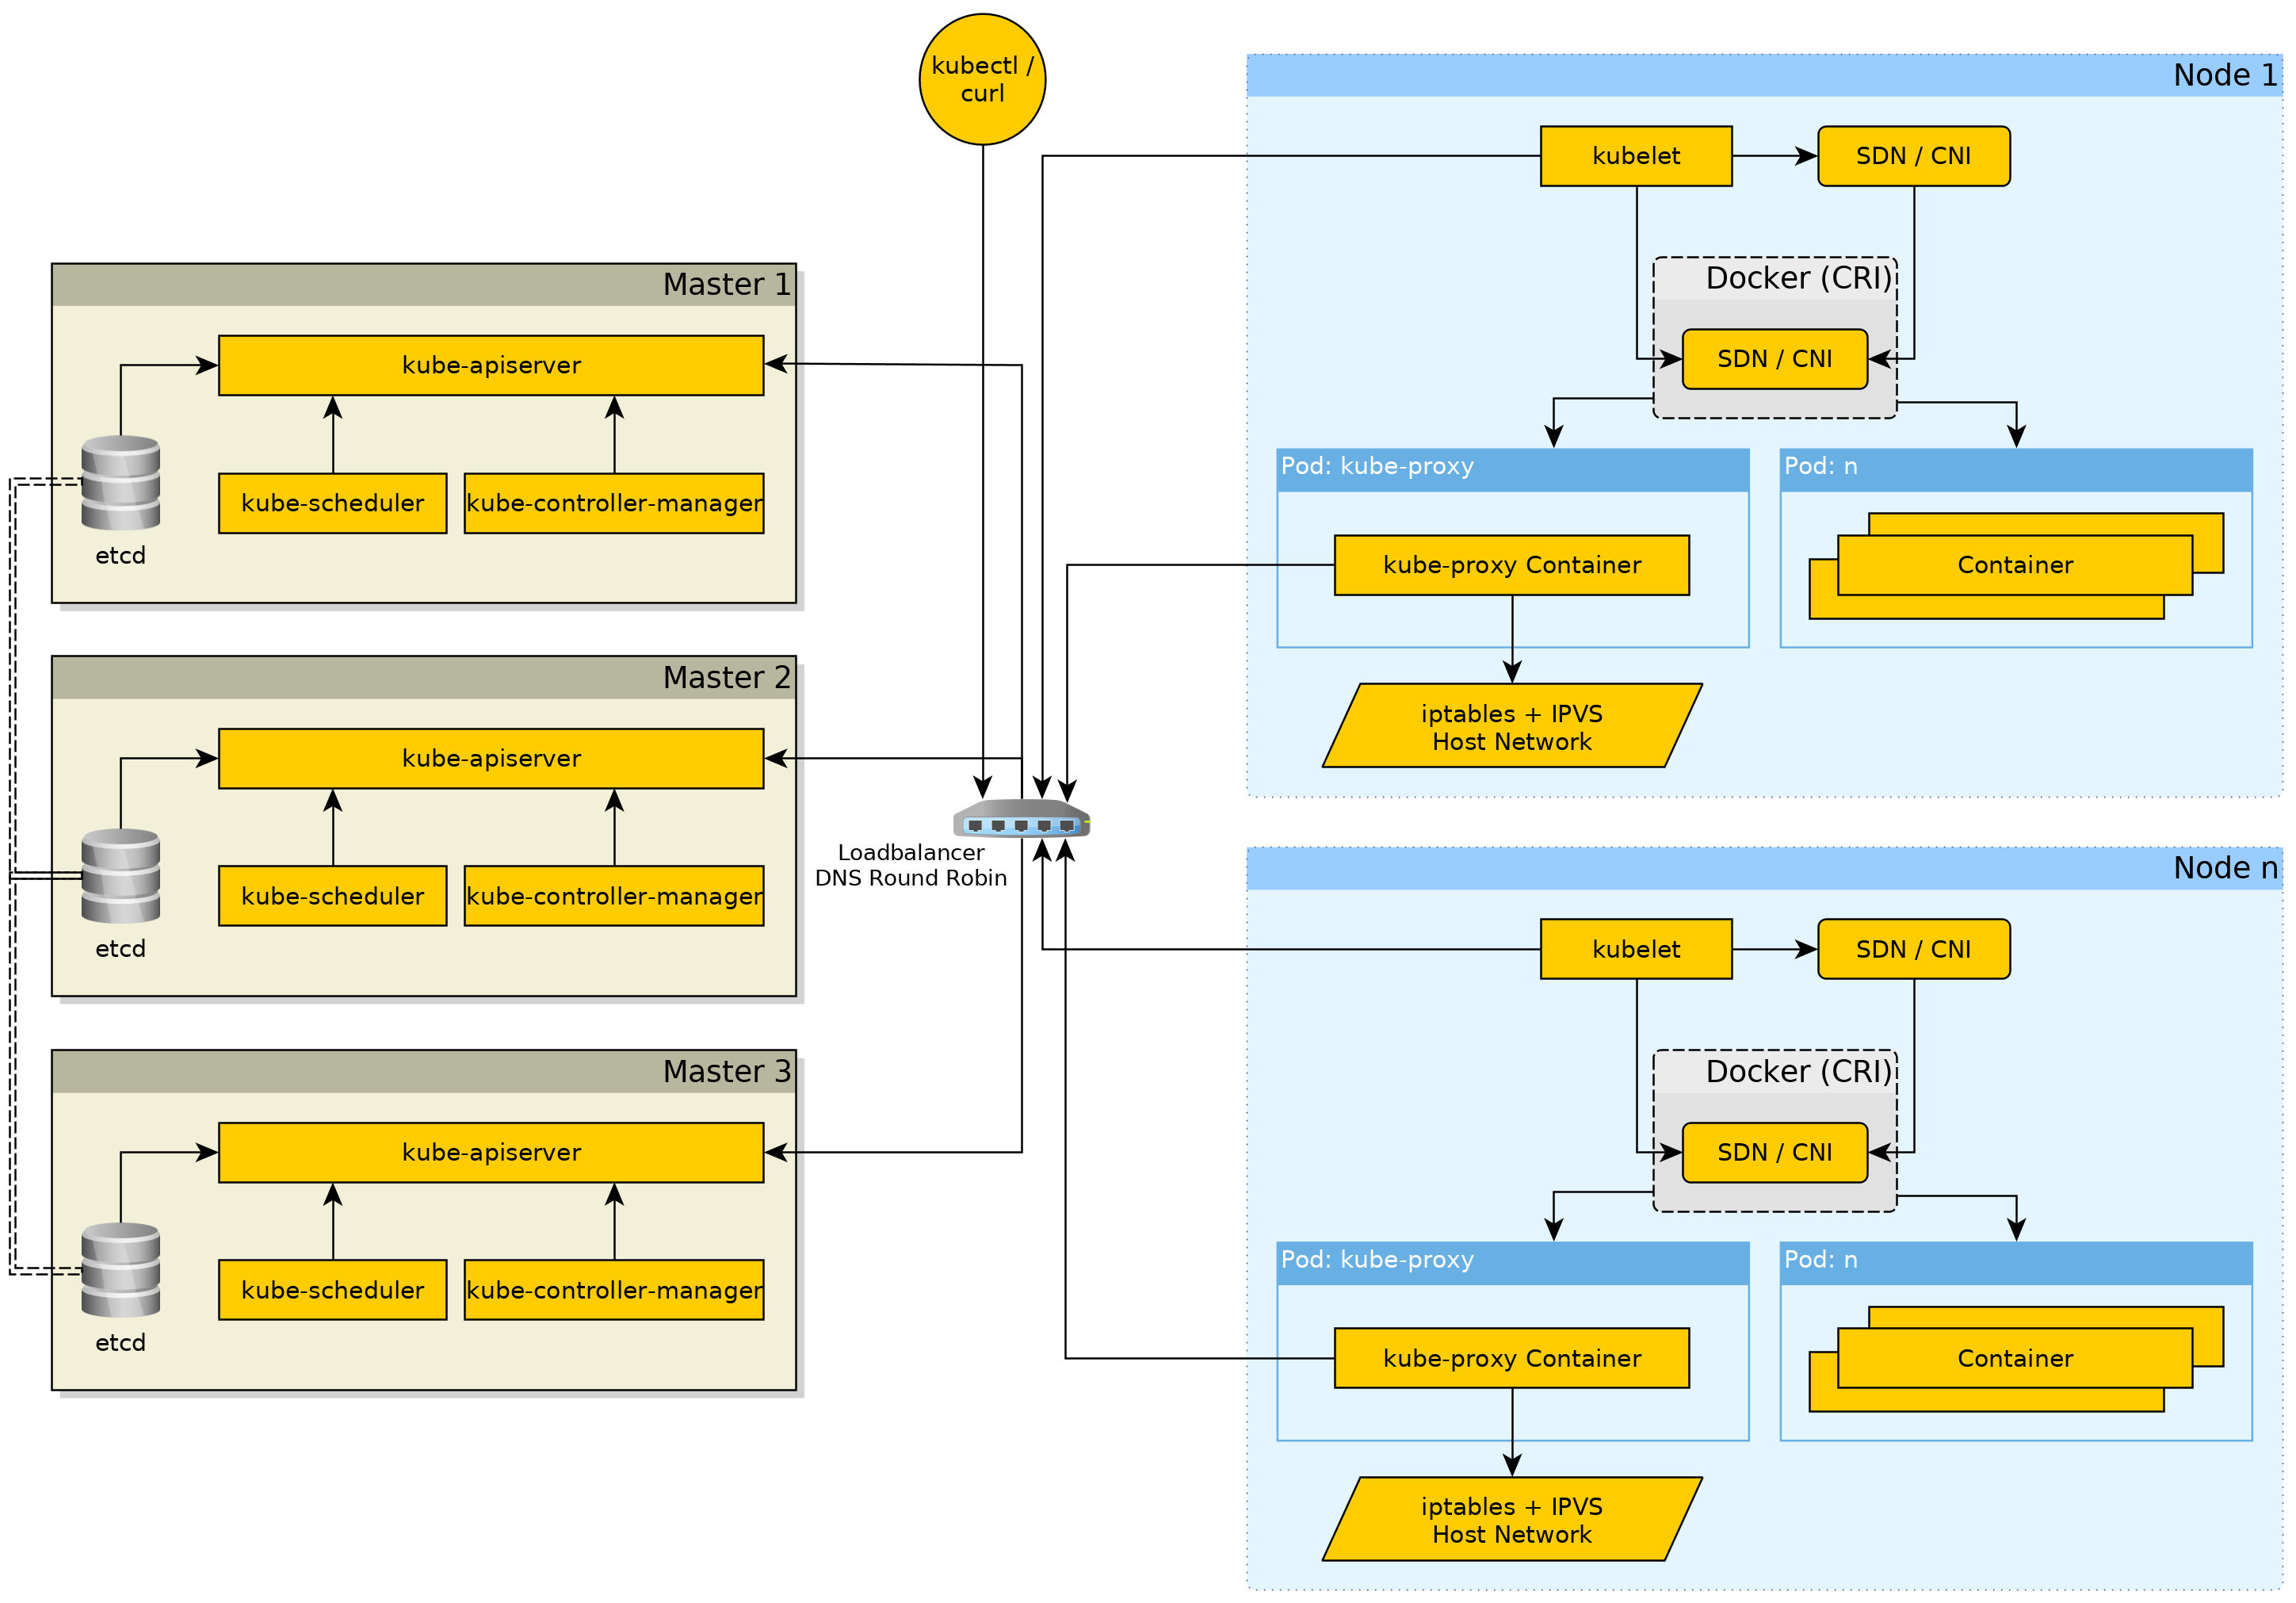
Remember this Kubernetes cluster architecture diagram?

Kubernetes Cluster architecture
Now we go over each component in more detail.
Master Components
Even though they are called “Master Components” this doesn’t mean they all need to run on the masters. For some components, e.g., etcd, it is recommended to run them on separate servers for better performance.
etcd - The brain
REFERENCE GitHub etcd-io/etcd.
The etcd is the brain of a Kubernetes cluster. It is responsible for storing all the Kubernetes objects. etcd in itself is a “distributed reliable key-value store for most critical data of a distributed system”. It uses the Raft for the clustering and failover logic. In the etcd documentation there is a whole documentation about the mechanism they have and what you can do with it, see etcd documentation - “Cluster Membership” Learner.
Kubernetes uses etcd v3 API since some time now, so you should hopefully not come across any Kubernetes clusters that still use etcd v2 API.
NOTE
Looking at the format in which Kubernetes stored objects with the etcd v2 API it is “easier” for humans to understand, but isn’t as performant as the v3 API. Kubernetes stores data in protobuf format with etcd v3 API, enabling Kubernetes to be pretty fast with its objects.
Running etcd can be a b*tch, but unless you throw away the etcd data every 5 minutes because you want refresh servers all the time you should not have too many problems.
TL;DR etcd is the data store of the Kubernetes objects. Can be a bottleneck of the Kubernetes cluster.
etcdctl is etcd’s client tool which allows you to do certain tasks against an etcd cluster. With etcdctl you can create, edit and delete keys (objects) and many more things, but you don’t want to do that unless you what you do. If you would edit objects you’ll can end up with Kubernetes being unable to decode objects and thus possibly causing the Kubernetes cluster to fail sooner or later.
Ironically I have wrote a documentation page about doing exactly that, “safely” editing Kubernetes objects in etcd, see Editing Kubernetes objects in etcd - Edenmal Docs.
From what people have told for bigger Kubernetes cluster installations (many nodes and / or many many users), the etcd can be a bottleneck depending on the (virtual) hardware. To quote such a post from memory:
“etcd was getting slower and slower with more people using the cluster:
- Checked the IO load on the Kubernetes master servers running etcd.
- Moved etcd to dedicated servers.
- Additionally put SSD or better under etcd data directory.
- And bottleneck is gone!”
If you want to read about more such bigger Kubernetes cluster scaling cases, just search for “Scaling Kubernetes to a million users” / “Issues scaling Kubernetes”.
NOTE Most people will “never” run more than at max 100+ nodes per cluster.
Unless you are Google or have very ambitious plans like me :-D
kube-apiserver
REFERENCE Kubernetes - kube-apiserver Reference.
When etcd is the brain of the Kubernetes cluster, the kube-apiserver is the ingestion system for information / obejcts so to speak of. The kube-apiserver is the only component talking to the etcd directly, all other upcoming are always only talking to the kube-apiserver!
NOTE
YES! All other components are talking through the kube-apiserver. The reason for that is simple, the kube-apiserver is the one instance that does authentication for users / ServiceAccounts*, validation (+ admission controlling) of objects.
*ServiceAccounts = are as the name implies “accounts” for services / robots, e.g., a token for your CI pipeline used for deployments to Kubernetes, controlled access for applications / operators to the Kubernetes API.
Ever heard of fancy custom Kubernetes objects (CustomResourceDefinitions) like Prometheus? kube-apiserver takes care of registering their paths in its API.
kube-controller-manager
kube-controller-manager is kind of the backbone as it uses the kube-apiserver to watch certain objects and the runs control loops to react on changes to them. Examples of those control loops:
Deploymentobject has itsreplicaschanged from2to5, the kube-controller-manager will then go ahead and update the currentReplicaSetfor theDeploymentand with that create the new Pods.- A
Nodehas not been updated (keeped alive) by the server’s kubelet since time n, kube-controller-manager will mark the node asNotReadyand then after some additional time evict (delete) the Pods from the node so they are rescheduled. - Allocating IP CIDRs to each
Nodein the cluster (if enabled). - Many more jobs of keeping in control of what is going on in the Kubernetes cluster.
cloud-controller-manager - Are you in the cloud?
Is like the kube-controller-manager, but for the cloud. It is talking with the underlying cloud provider to provide certain services of the cloud provider to Kubernetes.
To quote the documentation, as there isn’t really a better way to say it:
- Node Controller: For checking the cloud provider to determine if a node has been deleted in the cloud after it stops responding
- Route Controller: For setting up routes in the underlying cloud infrastructure
- Service Controller: For creating, updating and deleting cloud provider load balancers
- Volume Controller: For creating, attaching, and mounting volumes, and interacting with the cloud provider to orchestrate volumes
- Kubernetes Components Overview - cloud-controller-manager - Kubernetes
It is basically a cloud support for the kube-controller-manager.
kube-scheduler
REFERENCE Kubernetes - kube-scheduler Reference.
*hoping that the name makes it obvious to what the kube-scheduler does*
Well.. the kube-scheduler schedules Pods in the Kubernetes cluster. The kube-scheduler doesn’t just throw dice but will also take available resources on the Nodes, “placement” options (Pod- and Node Affinity / AntiAffinity, Taints and Tolerations) and even if supported by the used storage the “location” of PersistentVolumes into account to find the best place for each Pod.
It doesn’t do more but it also doesn’t do less than that.
NOTE
One thing that I want to note, but wouldn’t recommend unless you know what you are doing. You can tell objects, like Deployments, StatefulSets and so on, which scheduler to use (
schedulerNamefield). This means that you can run your own schedulers to assign Pods to Nodes on your own custom logic.
Node Components
This section is about all the components needed for a server to be a function Node in a Kubernetes cluster.
Container Runtime Interface
The Container Runtime Interface is an unified interface to talk to a Container Runtime (e.g., containerd, CRI-O), for more insight on Kubernetes side, see Kubernetes Blog - Introducing Container Runtime Interface (CRI) in Kubernetes.
Docker is also a Container Runtime that Kubernetes supports it, but right now this integration is directly through Docker (/ Moby) libraries instead of one unified interface which works for all container runtimes.
The point of different Container runtimes is, e.g., that Kata Containers is able to run containers in lightweight VMs to give (untrusted) workload more isolation.
It is needed on every Node that will run Pods in the end. Depending on how the Kubernetes cluster is installed, e.g., with kubeadm, all servers including the master servers can run containers (master servers are “restricted” (tainted) by default).
kubelet
REFERENCE Kubernetes - kube-apiserver Reference.
Besides the Container Runtime of your choice, the kubelet is the most important component on the Nodes (followed by the kube-proxy).
The kubelet is the one and only component which is talking with the container runtime to create and run containers for a Pod. For example the kubelet takes care of following tasks:
- Creating the containers with their shared (network) contexts.
- Depending on the storage used, mounts and if needed formats the volumes for each Pod.
- Besides PersistentVolumes mounting, it will also create the necessary volumes for ConfigMaps and Secrets.
- E.g., when using
emptyDiris used withmedium: memoryit takes care of creating the in-memory directory.
- E.g., when using
Besides that for the storage aspect it will talk with the “installed” CSI (/ FlexVolume) drivers to get the storage mounted.
kube-proxy
REFERENCE Kubernetes - kube-apiserver Reference.
You have heard about Services in Kubernetes? They have those cool ClusterIPs. The kube-proxy is the one that is setting up ipvs and iptables rules (depending on the “mode” chosen) so the Service ClusterIPs are reachable.
Kubernetes - Service IP iptables Diagram
(Originally taken from Kubernetes Network Explained - Service IP iptables - Edenmal Docs)
CNI / SDN
This was mostly covered in the previous Network section, but to summarize:
It takes care of the network for the Pods started by the kubelet. In most times the CNI will create a overlay network in “mesh network between all Nodes” style.
To name some CNIs:
- CoreOS Flannel: VXLAN Mesh network between the servers. The simplest network plugin that can span over more than one node.
- Project Calico: Either BGP + IP-IP or in form of Canal using Flannel for the traffic between the nodes.
- And many more Kubernetes - Cluster Networking …
Most CNIs are deployed through a DaemonSet that then runs the CNI in a container, which makes it easier to update and maintain.
Addons
DNS
“Isn’t the problem always either network, DNS or both?”
A Kubernetes cluster relies heavily on DNS. This is because Kubernetes itself provides service discovery through the Services which get a DNS name. Reason for that is that if running in another cluster the Service ClusterIP could be different for whatever reason (e.g., different network ranges used).
This addon is most of the time running inside of Kubernetes. The DNS server used is CoreDNS, which is “CoreDNS is a DNS server that chains plugins”. Should you run into performance issues with the DNS inside a Kubernetes cluster consider the following:
- Slow external name resolution?
- => Check what upstream DNS servers are used in the CoreDNS configuration (
corednsConfigMap inkube-systemnamespace).
- => Check what upstream DNS servers are used in the CoreDNS configuration (
- Getting weird DNS timeouts of >= 5 seconds?
Monitoring, Logging and more
These components / parts will be covered in the Operating a Kubernetes cluster section.
Operating a Kubernetes Cluster
What is an Operator? Making your life easier.

Jeopardy - Kubernetes 'What is an Operator' question
An Operator is a pattern in Kubernetes. What are you doing when running and taking care of an application? You are operating the application. Can you guess what an Operator (pattern) is doing in Kubernetes then?
An Operator takes care of running the application. You, the user, are just creating a custom object in Kubernetes, which has been defined by the operator creator. Based on that the operator reacts and, e.g., for Rook.io is creating each component of a Ceph cluster in Kubernetes through normal Deployment, StatefulSets and other objects.
Examples for operators:
- Rook.io operators - Run a whole Ceph cluster in Kubernetes, EdgeFS, NFS and more in Kubernetes with ease.
- CoreOS prometheus-operator - Run and configure Prometheus easily through custom objects in Kubernetes.
- Zalando postgres-operator - Run Postgres Clusters in Kubernetes.
- For more cool operators, checkout the OperatorHub.
These operators allow admins and developers to reduce the time spent on getting things to run / running applications in Kubernetes.
NOTE
This doesn’t mean that you, the user doesn’t need to know how to run, tune, maintain these applications. Operators are just automation and in the “worst” case manual intervention is the only help to fix bad issues unresolveable by automation.
Monitoring
Before going into the actual components, like Prometheus and Grafana that are used for monitoring, let’s talk about how you can get “agents” / exporters on the servers to get, e.g., metrics, logs and other useful stuff. The way to do that achieve that are DaemonSets.
DaemonSet
A DaemonSet is a way to run a Pod on any Node in the Kubernetes cluster.
Pods created through a DaemonSet are scheduled partially by the so called DaemonSet controller but also through the default scheduler since Kubernetes v1.12. Meaning that you can specify certain placement options, like NodeAffinity, every Node in the Kubernetes cluster will get a Pod of a DaemonSet scheduled on it.
For more information on how DaemonSet Pods are scheduled, see Kubernetes - DaemonSet - How Daemon Pods are Scheduled.
This is perfect for, e.g., deployment of CNI plugin (Flannel, etc) and for monitoring, but also logging such an “agent” / exporter can be deployed easily.
Grafana
Haven’t heard about Grafana yet? You’re in for a treat.
Grafana is the “best” tool for visualizing metrics.

Grafana Dashboard - Kubernetes Cluster Resources

Grafana Dashboard - Ceph Cluster Overview
Prometheus
Prometheus is the best cloud native for monitoring. Thanks to it, OpenMetrics, OpenCensus and many other projects have been sparked which allow to collect metrics and also do other things such as collecting traces. Prometheus itself is only for metrics though.
Big differences to most other monitoring systems is that the Prometheus server is pulling metrics from /metrics (or other paths) endpoints. Another difference is that there is no high availability concept in point of sharing the data bwtween one or more instances.
If you want HA, for Prometheus you just run more than one instance and use, e.g., remote storage which writes to InfluxDB or other time serires databases for the data high availability aspect.
Logging
Who needs logs anyway, am I right?
Logs are always a problem in the new cool container world.
The one application logs too much
Loki
Loki “Prometheus-inspired logging for cloud natives.”
An alternative to Elasticsearch, from the makers of Grafana.
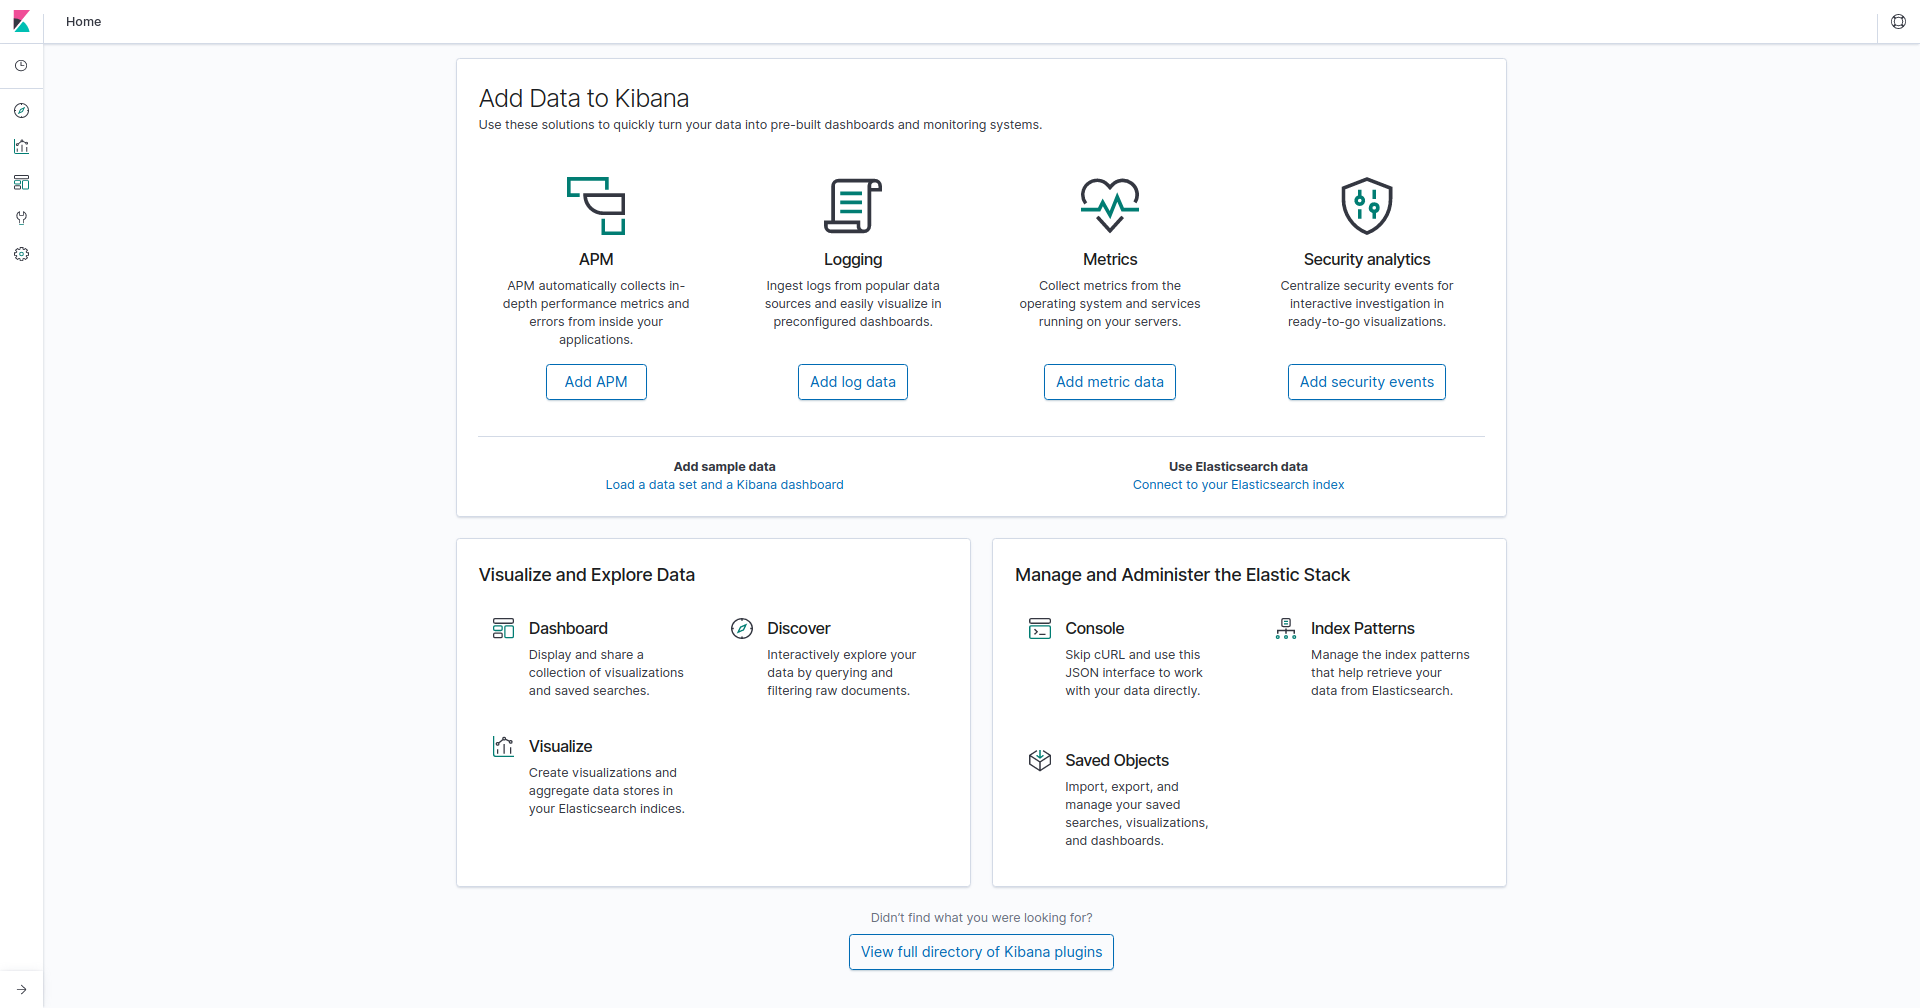
Kibana
Kibana is made by the guys a tool which is especially good for looking at logs is Kibana. Grafana can also display logs, but Kibana is better in that regard through their simple search interface. Sadly in Kibana I personally think the visualizations are not as good as in Grafana.

Kibana Home Site
Storing Logs
- EFK (Elasticsearch + Fluentd + Kibana)
- ELK (Elasticsearch + Logstash + Kibana)
There aren’t really alternatives besides Loki.
Storage
Local Storage
Is a feature to allow you to provide applications with storage from the nodes themselves for better performance.
WARNING
The storage is not replicated in any way as it is local on the Node!
Example: A Pod using Local Storage from Node A, will always be “forced” to run on Node A. Only when the user manually intervens the Pod would be “moved” to another Local Storage PersistentVolume.
This must be kept in mind when using Local Storage and already during planning.
Container Storage Interface (CSI) - In memory of FlexVolume
CSI allows storage providers to easily provide their storage to any software / platform through the CSI standard.
This is especially good for Kubernetes as this allows bugs in volume providers / drivers to be fixed faster, than if they would be in-tree in Kubernetes (in the Kubernetes code).
Rook.io FTW!?
Rook can run storage providers for you through operators, e.g., Cassandra, Ceph, CockroachDB, EdgeFS, Minio, NFS and YugabyteDB.
Maintenance Tasks
Upgrading a Cluster (Order)
Any pre-upgrade processes documented / communicated must be applied before upgrading components.
- Master Components
kube-apiserverkube-controller-manager- If used,
cloud-controller-manager.
- If used,
kube-scheduler
- Node Components
kubeletkube-proxy
After that other components, like, e.g., CNI plugin, Monitoring, Operators.
Cordon (Bleu) my Nodes
Cordoning a Node makes it unschedulable (bleed out as no new Pods are scheduled on it then).
kubectl cordon NODE_NAME
Drain a Node
Draining a Node removes each Pod from a Node and marks it as cordoned (unschedulable). This is useful when, e.g., wanting to maintenance to a Node.
NOTE
Be aware though that if users run applications in Kubernetes with
replicas: 1they will have a service intrruption, due to Pods bein terminated and created on another Node.
kubectl drain NODE_NAME
kubectl drain --ignore-daemonsets=true NODE_NAME
kubectl drain --ignore-daemonsets=true --delete-local-data=true NODE_NAME
# I would recommend adding the `--timeout=0s` flag with a decent timeout time
Summary of the Day
If you are reading this, you have made it to the end of day #2. Well done, sir or madam, have a second cookie!

Here is a Cookie (from Memegen)
I hope everyone had a good time during the training’s first day and has taken new knowledge with them already. If you have any feedback about the training itself or the materials, please let me know in person or email me at me AT galexrt DOT moe.
Have Fun!
